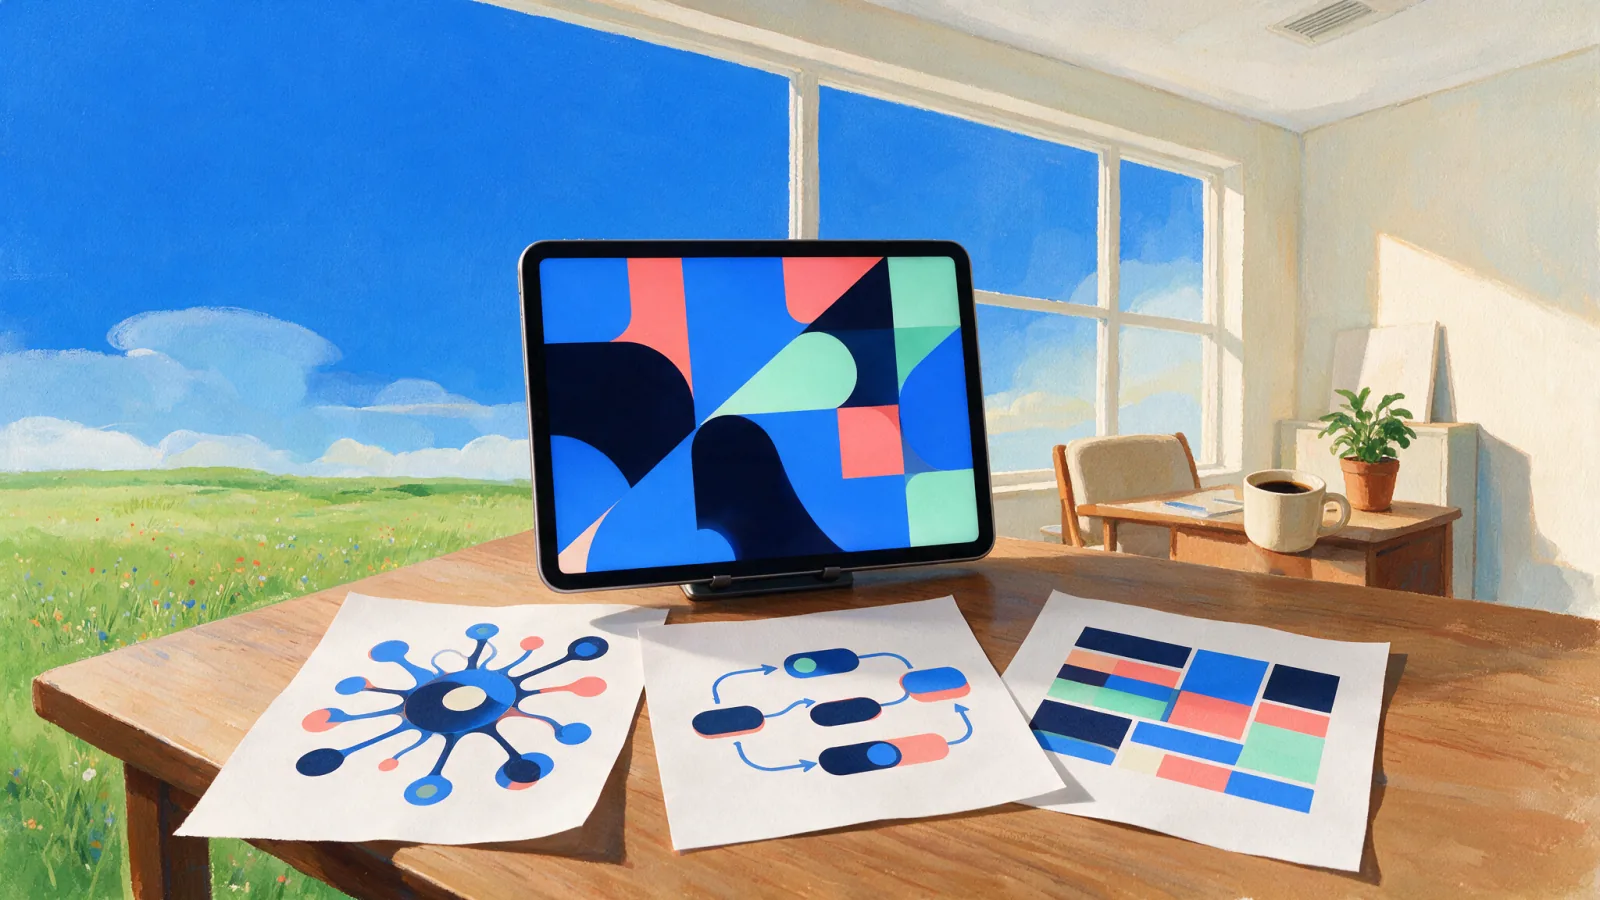
Visual meeting notes are a one-page picture of a meeting — an infographic, a mind map, or a flow diagram — that shows what was discussed and decided; today they come from three very different places: a human graphic recorder, Google Meet's automatic screenshots, or AI that draws the note from the transcript.
The distinction matters. A graphic recorder interprets the room in real time. A screenshot preserves something that appeared on screen. An AI-drawn note reorganises the spoken discussion after it has been transcribed. All three are useful, but they answer different questions.
For a workshop where the drawing is part of the experience, hire a graphic recorder. To preserve a slide, demo, or shared screen in a Google Meet call, automatic screenshots are the direct fit. For recurring online and In-person meetings that need a quick, shareable picture of themes, decisions, and owners, use an AI-drawn visual backed by a transcript.
A visual note is the scan-first layer. Keep the summary for context and the transcript for exact wording.
What counts as a visual meeting note?
A visual meeting note is any visual record that helps someone grasp a meeting without reading a page of linear prose, but the term now covers three outputs with different makers, inputs, and limits.
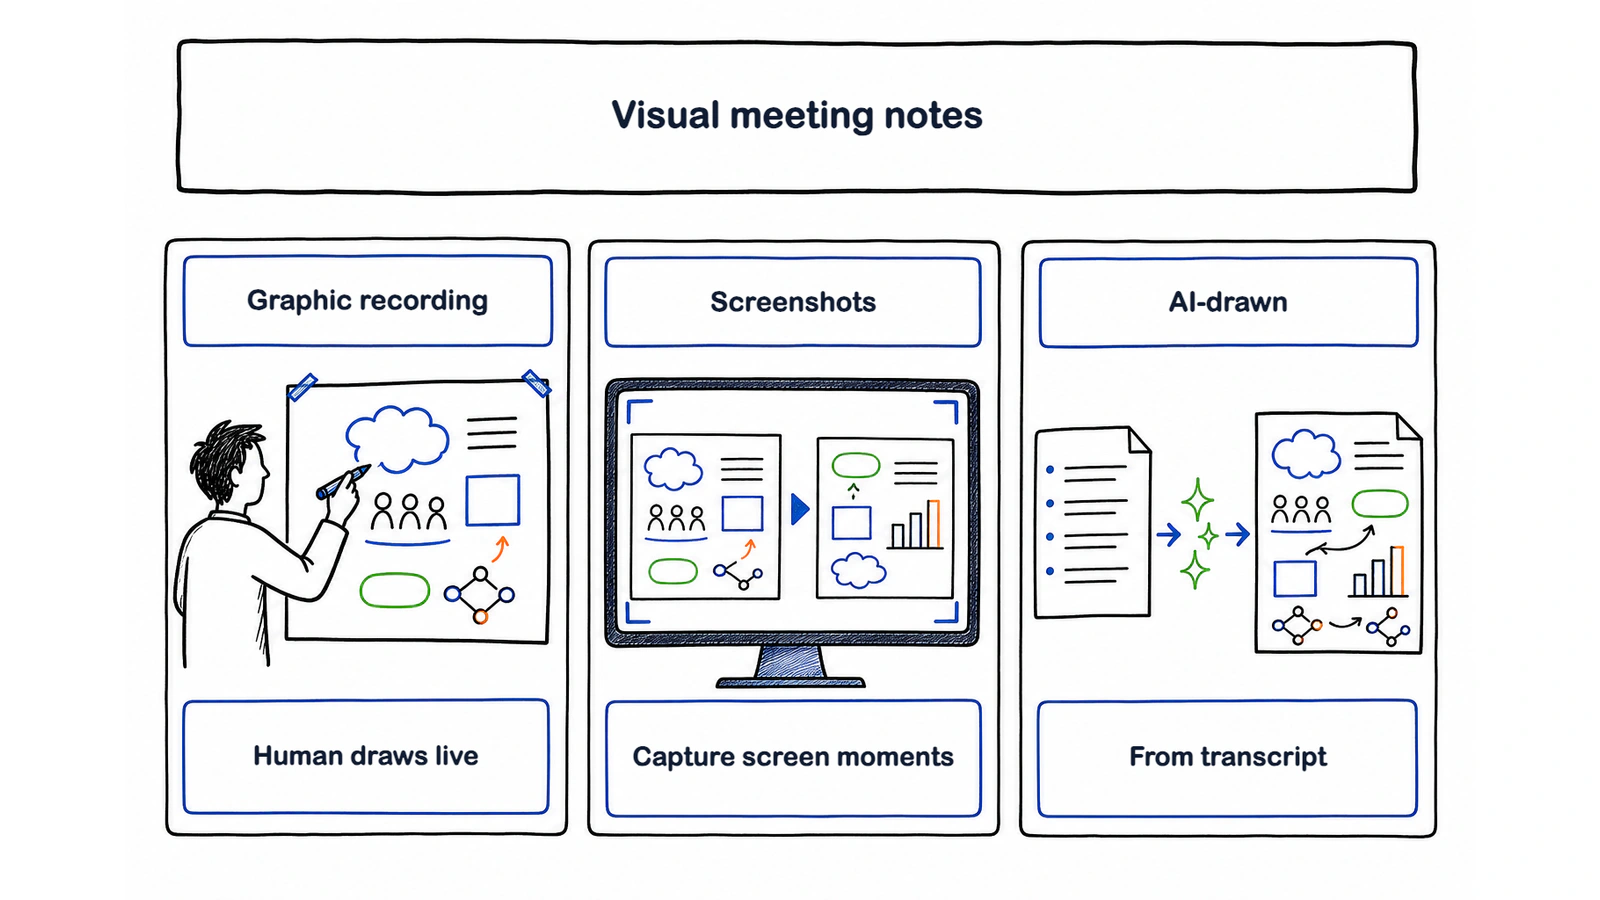
| Source | Maker and input | Output and timing | Cost | Best for | Limits |
|---|---|---|---|---|---|
| Graphic recording | A human illustrator listens to live speech, room context, and audience reactions | A hand-drawn board or digital canvas, created live with possible cleanup later | Professional service quoted for the event | Workshops, conferences, and high-stakes sessions where the drawing is part of the experience | Must be scheduled; interpretation depends on one person's listening and choices |
| Google Meet screenshots | Google Meet captures visual moments shown during a Meet call | Automatic screenshots placed inside meeting notes during the meeting workflow | Google Workspace access and feature availability apply | Preserving slides, demos, and other material that appeared on screen | Captures what appeared; it does not redraw the spoken discussion into a map |
| AI-drawn note | An AI system works from a transcript, usually made from a recording or uploaded file | A one-page infographic, mind map, or flow diagram generated after transcript processing | Varies by tool | Recurring online or In-person meetings that need a fast, shareable recap | Can misread the transcript or emphasis; people should verify names, numbers, owners, and dates |
Google began rolling out automatic visual screenshots inside Meet notes in August 2026. That makes a screenshot one current meaning of “visual meeting notes,” but it remains a record of pixels that were shown. If the group discussed several options without showing a slide, a screenshot cannot reveal the shape of that discussion.
Human graphic recording sits at the other end. The recorder listens, chooses what deserves space, and uses words, icons, arrows, and proximity to tell a story. The result can carry the energy and personality of the room. It also requires a skilled person to be there.
AI-drawn notes start from the meeting record instead. A tool can take a transcript, find the main subjects and commitments, then choose a visual arrangement. That makes the method repeatable for a weekly project check-in, a customer interview, or a meeting recorded on a phone.
What does a good visual note contain?
A good visual note lets a colleague identify the meeting, the conclusion, and the next responsibility quickly, without pretending to preserve every sentence.
Start with the title and purpose. “Campaign performance review” is useful; “Weekly sync” tells a future reader almost nothing. Add the date or team when several meetings could share the same title.
Give decisions more visual weight than discussion points. A reader should not have to infer whether the launch plan was approved, proposed, or rejected. Put owners and dates beside action items, not in a disconnected legend. If no owner or deadline was agreed, the note should not invent one.
Show the shape of the discussion. Branches work when ideas split from one topic. A sequence works when one step leads to another. Side-by-side panels work when teams compared options or reported separate workstreams. End with one takeaway that states what changed because the meeting happened.
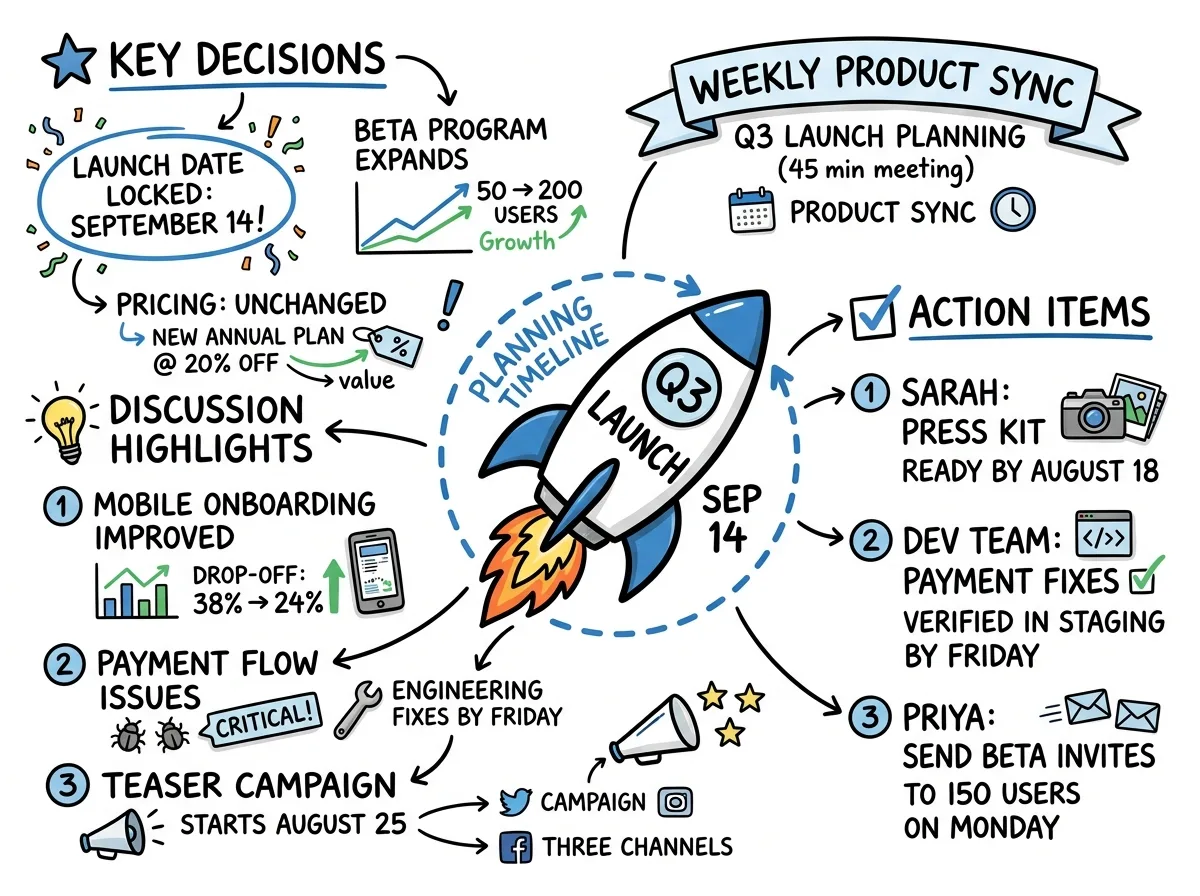
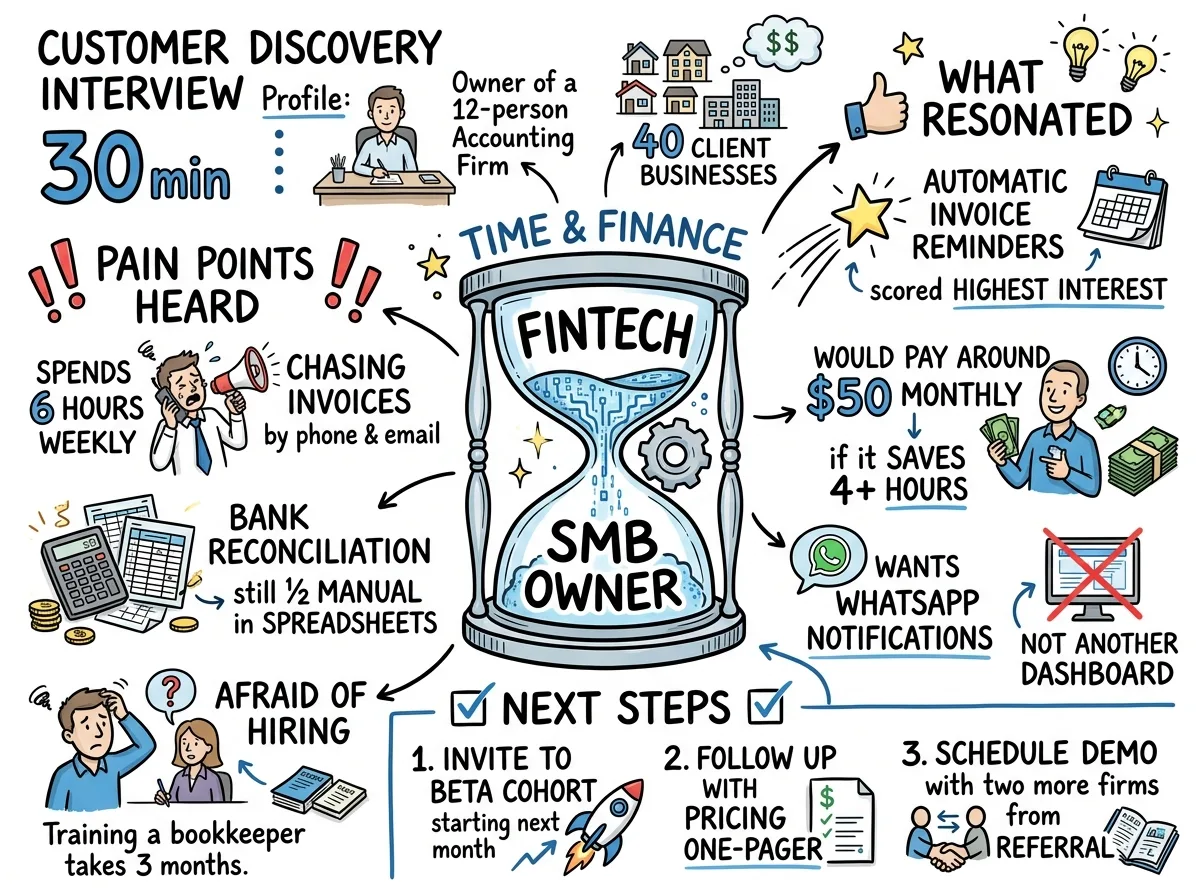
The first example is useful for scanning ownership. The second can emphasise sequence or relationships, depending on the meeting. Neither needs to copy the transcript line by line.
A crowded page is not automatically more complete. If every transcript detail becomes a box, the picture loses the hierarchy that makes it useful. Remove repeated context, decorative icons, and side comments before removing a decision or a named commitment.
Infographic, mind map, or flow: what's the difference?
An infographic organises a recap into panels, a mind map branches from one central subject, and a flow diagram shows order, movement, or cause and effect.
Use an infographic for a status update, board recap, research readout, or weekly review. It can place metrics, decisions, risks, and next steps in distinct sections without implying that one caused another.
Use a mind map for discovery calls, brainstorms, lessons, and early planning. The centre names the shared subject; branches expose themes and subthemes. A mind map is less useful when the meeting revolves around a strict sequence or handoff.
Use a flow diagram for incident reviews, operating procedures, customer paths, and approval routes. Arrows must mean something specific. They might show time, dependency, or responsibility, but should not mix all three.
Some meetings need a hybrid. A project review may use panels for workstreams and a short flow for the release path. The test is simple: does the layout make the relationship between points clearer? See which visual fits which meeting for worked examples by meeting type.
How does AI draw a note from a recording?
AI draws a visual note by turning audio into a transcript, extracting the meeting's structure, and assigning that structure to a readable one-page layout.
The first step is capture. For an online meeting, Meeting.ai can send the Meeting Bot to Google Meet, Zoom, or Microsoft Teams. For an In-person discussion, record from the browser or place a phone running the mobile app where everyone can be heard. You can also upload existing audio or video.
Next comes the transcript. Voice Match can label who said what. The system then identifies topics, decisions, open questions, and action items. Those distinctions matter: “Rina will send the revised brief on Friday” belongs in a different visual position from “Could Rina revise the brief?”
The layout stage compresses that structured information. A central topic may become a mind map. A progress meeting may become an infographic with separate workstreams. A process discussion may become a flow. Meeting.ai produces the searchable, time-stamped transcript, an AI-Powered Summary, and a Visual Note for the same meeting, so a reader can move from the picture back to its source.
The output is a compressed interpretation. Crosstalk, weak audio, similar names, and specialist vocabulary can distort the transcript. A polished layout can make an error look more certain than it is. Review the image against the summary and transcript before it leaves the team. The summary and Visual Note guide explains where each output appears.
When is a visual note better than a text summary, and when isn't it?
A visual note is better when the reader needs the whole shape quickly; a text summary is better when nuance, conditions, or precise wording carry the meaning.
There is a real basis for using pictures, but the careful claim is narrower than popular marketing lines. Memory experiments by Shepard in 1967 and Standing in 1973 found a picture-superiority effect: people recognised and recalled pictures better than equivalent words in those tasks. That does not prove that every infographic beats every written summary.
Concept maps have stronger evidence for structured relationships. A 2018 meta-analysis covering 142 effect sizes and 11,814 participants found a moderate learning benefit overall, with larger effects when people built the map themselves than when they only studied one. An AI-made map removes that act of construction, so it should be treated as a scan and discussion aid, not a guaranteed memory boost.
Choose a visual note when you need to:
- catch up on the main structure before reading details;
- compare workstreams, options, or themes on one page;
- share a meeting recap in a team channel or presentation;
- see how decisions connect to owners and next steps.
Choose a text summary when you need to preserve caveats, reasoning, objections, legal wording, or a detailed narrative. Choose the transcript when someone asks, “What exactly did we say?”
Claims that 65% of people are visual learners or that the brain processes images 60,000 times faster than text do not have a sound source. Do not use them to justify a visual workflow. The evidence and the myths are separated in what research says about visuals and memory.
Do visual notes replace minutes or transcripts?
No. Visual notes, meeting minutes, and transcripts serve different jobs, and a reliable meeting record keeps all three connected.
The transcript is the closest record of the words spoken. Search it when a number looks wrong, when a decision is disputed, or when exact phrasing matters. Timestamps help a reviewer return to the relevant moment.
The minutes or AI-Powered Summary explain what happened in concise prose. They carry context that a compact picture may omit: why an option was rejected, what assumption sits behind a deadline, or which question stayed unresolved.
The Visual Note is the entry point. It helps someone scan the topics, decisions, and action items before deciding where to read deeper. A practical sharing bundle is one picture at the top, a short summary underneath, and a link to the transcript for evidence.
That trio also makes corrections safer. If the picture assigns an action item to the wrong Alex, the team can verify the timestamp, correct the working record, and regenerate the visual rather than debating the graphic on its own.
Which tools make visual meeting notes today?
Several tools made visual meeting outputs by August 2026, but they differ in what they accept and what they draw, so this is a category map rather than a ranking.
- Meeting.ai records online meetings through the Meeting Bot, records In-person meetings from the browser or mobile app, and accepts uploads. It creates a one-page Visual Note alongside the time-stamped transcript and AI-Powered Summary.
- Pique presents the recording as an interactive, colour-coded mind map with draggable branches and links back to moments in the audio. Its research listing describes on-device capture without a meeting bot.
- Notta publishes a meeting-infographic workflow and an AI mind-map tool. Its April 2026 visual guide frames the output as a visual summary made from meeting content.
- Plaud offers infographic output and described mind maps and custom summaries in July 2026. It starts from material captured through its hardware and app workflow.
- Mapify turns supplied meeting transcripts and conversations into mind maps. Its March 2026 guide is aimed at people who already have a transcript to summarise.
- Lilys AI lists mind maps, infographics, and cartoons among its Korean output templates, alongside live recording meeting notes. The research could not verify that every visual format works from a live meeting recording, so check that path before choosing it for that use.
- NoteGPT has separate sketchnote, visual, mind-map, and diagram generators. The audited sketchnote page starts from text or files rather than capturing meeting audio itself.
Other familiar meeting-note tools may stop at transcripts and text summaries. These boundaries change quickly. Check the input path and an actual output sample before choosing; the word “visual” on a feature page does not show what the tool will make from your meeting.
How do I start making visual meeting notes?
Start with one real meeting, keep its transcript, and judge the visual by whether it makes the decision and next action easier to find.
- Choose the capture path. Invite the Meeting Bot for Google Meet, Zoom, or Microsoft Teams; place your phone where it can hear an In-person meeting; or upload an existing recording. Tell participants that you are recording and check the rules that apply to the people and place involved. See is it legal to record a meeting? for the consent checklist.
- Review the three outputs. Open the Visual Note first, then check every name, number, owner, and date against the AI-Powered Summary and time-stamped transcript. A visual is ready to share only when its important facts match the source.
- Share the right layer. Send the one-page picture for the quick catch-up. Add the summary for context and the transcript link for anyone who needs exact wording. If the layout hides the real relationship between points, regenerate it or use a different format.
Meeting.ai is designed for this full path: prepare before the conversation, capture what happens during it, and turn the record into useful follow-up after it. Before sharing a Visual Note, ask whether a reader can identify the decision, owner, and next step without mistaking an inference for something a participant said. If not, regenerate the visual or share the checked text instead.